
📈 Communicate your results effectively with the best data visualizations

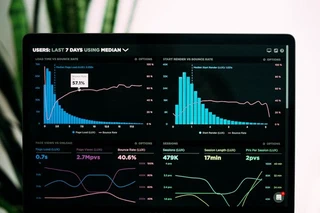 Image credit: Unsplash
Hugo Blox is designed to give technical content creators a seamless experience. You can focus on the content and Hugo Blox handles the rest.
Use popular tools such as Plotly, Mermaid, and data frames.
Embed Rich Content
HuggingFace Model
HuggingFace Dataset
a.k.a. Awesome ChatGPT Prompts This is a Dataset Repository mirror of prompts.chat — a social platform for AI prompts. 📢 Notice This Hugging Face dataset is a mirror. For the …
GitHub Repository
🧱 Describe your site, AI builds it, you own it as Markdown. Snap together Tailwind blocks like Lego — landing pages, blogs, portfolios, docs & more. No AI slop. Free to deploy anywhere 👇
Custom embed with manual data
A great resource for learning
Custom Images
Embed beautiful images from any source with Hugo image processing (Unsplash, custom URLs, etc.):

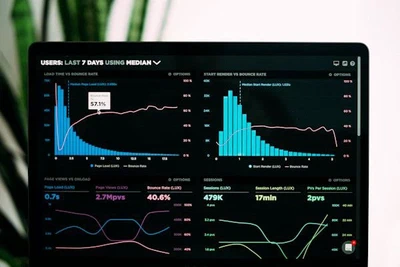
Beautiful data visualization workspace
You can also add images to any platform embed:
Charts
Hugo Blox supports the popular Plotly format for interactive data visualizations. With Plotly, you can design almost any kind of visualization you can imagine!
Save your Plotly JSON in your page folder, for example line-chart.json, and then add the {{< chart data="line-chart" >}} shortcode where you would like the chart to appear.
Demo:
You might also find the Plotly JSON Editor useful.
Diagrams
Hugo Blox supports the Mermaid Markdown extension for diagrams.
An example flowchart:
```mermaid
graph TD
A[Hard] -->|Text| B(Round)
B --> C{Decision}
C -->|One| D[Result 1]
C -->|Two| E[Result 2]
```
renders as
An example sequence diagram:
```mermaid
sequenceDiagram
Alice->>John: Hello John, how are you?
loop Healthcheck
    John->>John: Fight against hypochondria
end
Note right of John: Rational thoughts!
John-->>Alice: Great!
John->>Bob: How about you?
Bob-->>John: Jolly good!
```
renders as
An example class diagram:
```mermaid
classDiagram
Class01 <|-- AveryLongClass : Cool
Class03 *-- Class04
Class05 o-- Class06
Class07 .. Class08
Class09 --> C2 : Where am i?
Class09 --* C3
Class09 --|> Class07
Class07 : equals()
Class07 : Object[] elementData
Class01 : size()
Class01 : int chimp
Class01 : int gorilla
Class08 <--> C2: Cool label
```
renders as
An example state diagram:
```mermaid
stateDiagram
[*] --> Still
Still --> [*]
Still --> Moving
Moving --> Still
Moving --> Crash
Crash --> [*]
```
renders as
Data Frames
Save your spreadsheet as a CSV file in your page’s folder and then render it by adding the Table shortcode to your page:
{{< table path="results.csv" header="true" caption="Table 1: My results" >}}
renders as
| customer_id | score |
|---|---|
| 1 | 0 |
| 2 | 0.5 |
| 3 | 1 |
Interactive Buttons
Add engaging call-to-action buttons to your data visualization posts:
Basic Buttons
{{< button url="/" >}}Contact Us{{< /button >}}

{{< button url="https://plotly.com/python/" new_tab="true" style="secondary" >}}Learn Plotly{{< /button >}}
Styled Buttons for Data Actions
{{< button url="#" style="primary" size="lg" align="center" icon="chart-bar" >}}View Dashboard{{< /button >}}

{{< button url="/data/results.csv" style="outline" icon="document-arrow-down" >}}Download Data{{< /button >}}

{{< button url="https://github.com/HugoBlox" new_tab="true" style="ghost" icon="arrow-top-right-on-square" icon_position="right" >}}View Source Code{{< /button >}}
Multiple Aligned Buttons
{{< button url="https://jupyter.org/" new_tab="true" style="secondary" rounded="full" align="center" >}}Try Jupyter{{< /button >}}

{{< button url="https://colab.research.google.com/" new_tab="true" style="primary" rounded="full" align="center" icon="rocket-launch" >}}Open in Colab{{< /button >}}
Did you find this page helpful? Consider sharing it 🙌

I am an Assistant Professor at Wrocław University of Science and Technology, with research focused on cybersecurity, cryptography, blockchain, and AI security. Within the Department of Applied Informatics, I am currently leading the Cybersecurity and Neuroinformatics Laboratory and supervising the Strategic Student Research Club of Neuroinformatics “Neuron”.
My academic career is complemented by extensive executive-level cybersecurity industry experience. I currently hold the position of Head of Cybersecurity Operations at an industry-leading biotechnology company. Previously, I held senior leadership positions including Chief Security Architect at the Orange R&D Centre and Senior Security Specialist at IBM and in the banking sector. I also gained experience working at a government law enforcement and as a court Digital Forensics expert.
I act as an expert evaluator for the European Commission (Horizon 2020, Horizon Europe, Digital Europe Programme) and the National Centre for Research and Development (NCBiR), reviewing R&D projects in cybersecurity, ICT, blockchain, and AI.
Certified: CISSP (ISC)², EnCE, CEH, ITIL, CompTIA Security+.